From Asia, to Europe and the Americas
We've analysed and ranked the 20 most popular traditional dishes for their health impact.
Key findings
- The Full English Breakfast contains 6 ultra-processed ingredients, versus an average of 1.6 in the other 19 dishes—280% more UPFs than the global average.
- There is evidence to suggest USA's Cheeseburger and Fries, and Turkey's Doner Kebab are healthier breakfast options.
- At 1,279 kcal, the Full English packs in 95% more calories than the 673 kcal average of other traditional dishes worldwide.
- With the highest UPF count and calorie load of all 20, the Full English ranks dead last in our health scoring
- The Full English packs 3,141 mg of sodium, 204% more than the 1,031 mg average of the other 19 dishes.
- 65% more sugar than the 5.2 g average globally—despite being a “savory” breakfast staple
What we did
With ultra-processed foods and digestive problems on the rise, we wanted to know: how healthy are the planet’s most iconic national dishes that have been passed down through generations.
So we analysed every ingredient within the 20 meals you’re most likely to see on dinner tables or menus worldwide, using verified nutrition data from global databases Nutritionix, SnapCalorie, Fitia, USDA, and added our own scoring model built around calories, fibre, fat, sugar, sodium, number of ultra-processed components, presence of additives, and whether the dish contains fermented foods or one of our 5 a day for bonus points.
Firstly, some stats
53%
Of the UK's calorie intake is from Ultra Processed Foods
90%
Of brits don't meet the recommended daily fibre intake of 30g.
Numbers published by Public Health England
#2
The UK has the second highest consumption of UPF's. Second behind the USA
Data from the British Medical Journal
The league table
We scored each dish using 10 health-linked metrics, normalised into a 0–100 scale.
(Lower score = worse for our health).
| Rank | Country | Dish | kcal | Fat (g) | Sugar (g) | Sodium (mg) | Fibre (g) | Ultra-Processed items | Additives | Fermented foods | Score (/100) |
|---|---|---|---|---|---|---|---|---|---|---|---|
| 1 | UK | Full English Breakfast | 1,279 | 89.5 | 8.5 | 3,141 | 8.5 | 6 | Yes | No | 32.4 |
| 2 | Australia | Meat Pie & Chips | 1,341 | 72 | 5 | 1,800 | 4 | 4 | Yes | No | 48.5 |
| 3 | Turkey | Döner Kebab | 950 | 58 | 5 | 1,650 | 3 | 4 | Yes | No | 51.7 |
| 4 | USA | Cheeseburger & Fries | 1,009 | 51 | 10 | 1,190 | 9 | 4 | Yes | No | 57.5 |
| 5 | Canada | Poutine | 886 | 57 | 1 | 1,588 | 5 | 3 | Yes | No | 58.4 |
| 6 | China | Sweet & Sour Pork | 964 | 28 | 24 | 1,000 | 3 | 2 | Yes | No | 61.2 |
| 7 | Greece | Moussaka | 556 | 29 | 6 | 800 | 4 | 2 | Yes | No | 62.6 |
| 8 | Thailand | Pad Thai Curry | 600 | 22 | 8 | 1,100 | 4 | 1 | Yes | No | 64.2 |
| 9 | Russia | Beef Stroganoff | 450 | 24 | 4 | 800 | 2 | 2 | Yes | No | 68.7 |
| 10 | Mexico | Tacos | 420 | 16 | 7 | 510 | 4 | 1 | Yes | No | 68.9 |
| 11 | Indonesia | Nasi Goreng | 619 | 23 | 4 | 900 | 3 | 1 | Yes | No | 69.7 |
| 12 | Germany | Bratwurst & Sauerkraut | 843 | 55 | 4 | 1,800 | 5 | 2 | Yes | Yes | 71.4 |
| 13 | Italy | Spaghetti Bolognese | 667 | 22 | 6 | 637 | 6 | 1 | Yes | No | 73.3 |
| 14 | Brazil | Feijoada (Black bean stew) | 620 | 35 | 2 | 1,100 | 7 | 1 | Yes | No | 74.3 |
| 15 | Spain | Paella | 752 | 34 | 2 | 1,300 | 4 | 1 | Yes | No | 74.7 |
| 16 | France | Pot-au-Feu | 535 | 16 | 4 | 900 | 6 | 0 | No | No | 80.0 |
| 17 | Nigeria | Jollof Rice | 393 | 15 | 2 | 700 | 4 | 1 | Yes | No | 82.7 |
| 18 | India | Dal & Rice | 293 | 6 | 1 | 600 | 7 | 0 | No | No | 90.1 |
| 19 | Japan | Miso Soup + Rice | 264 | 3 | 1 | 705 | 1 | 0 | No | Yes | 91.4 |
| 20 | South Korea | Kimchi & Rice | 300 | 1 | 2 | 500 | 5 | 0 | No | Yes | 92.0 |
Key Findings in detail
- Full English Breakfast ranks worst in nearly every category, second highest in calories (1 279 kcal) and highest in fat (89.5 g), sodium (3 141 mg), ultra‑processed ingredients (6) and additives, with zero fermented foods.
- Meat Pie & Chips is second worst: 1 341 kcal and 4 UPFs.
- Döner Kebab (Turkey) is a surprise “healthier” contender with 26% fewer calories and 33% fewer UPFs than the Full English.
- Cheeseburger & Fries ranks 4th with 1 009 kcal and 9 g fibre, narrowly beating out poutine.
- Only 3 of the 20 dishes include fermented foods (sauerkraut, miso, kimchi), highlighting how rare gut friendly staples are globally.
- The average UPF count across all dishes is 1.6. Full English’s 6 UPFs is a 280% spike above that average.
- Fibre remains low across the board: even the highest‑fibre dishes provide only 40–60% of the recommended 25 g/day.
- Sodium overload is common throughout the list, however the Full English delivers 136% of the UK’s daily salt limit in one meal.
- Kimchi & Rice (South Korea) and Miso Soup & Rice (Japan) top the health leader board, both low calories, minimal processing, plus containing fermented foods, often seen as the best foods for gut health.
A word from our Specialist Dietitian

This analysis sheds light on just how nutritionally imbalanced many of our most beloved traditional dishes can be especially when it comes to ultra-processed ingredients, excess saturated fat, sodium, and low fibre content. These are not just minor dietary concerns; they’re major contributors to long-term health risks like heart disease, type 2 diabetes, and inflammatory conditions.
The goal isn’t to remove cultural foods from our plates, but to bring greater awareness to their composition, and consider simple adjustments like boosting fibre, reducing additives, or incorporating more fermented foods that can support gut health and overall wellbeing.
There is always a way to make a meal healthier and that can simply be done by the method of cooking a food, or by substituting an ingredient for a slightly healthier option.
What we measured and why
| Metric | Why it matters |
|---|---|
| kcal | Total calories per serving. Excess calorie intake can contribute to weight gain, obesity, and related diseases such as type 2 diabetes and cardiovascular conditions. |
| Fat (Sat/trans) |
Includes: • Saturated fats — Linked to higher LDL cholesterol and increased risk of heart disease when consumed in excess. • Trans fats — Are artificially created fats strongly associated with coronary artery disease, inflammation, and poor metabolic health. |
| Sugar (Added) | We measured the added sugars (not naturally occurring). High sugar intake is associated with obesity, insulin resistance, tooth decay, type 2 diabetes, and fatty liver disease. |
| Sodium (Salt) | Measures total sodium content. High sodium is linked to elevated blood pressure, increased risk of heart attack and stroke, and kidney stress. |
| Fibre | Indicates fibre from vegetables, legumes, whole grains. Fibre supports digestive regularity, blood sugar control, heart health, and long-term weight management. It also helps to support gut health. |
| Ultra-Processed items | Number of ultra-processed items based on NOVA classification. Diets high in UPFs are linked to obesity, metabolic syndrome, increased cancer risk, and mental health concerns like depression. |
| Additives |
• Emulsifiers (e.g. Polysorbate 80, CMC) — Linked to inflammation and altered metabolic markers in animal and emerging human studies. • Artificial sweeteners (e.g. Sucralose, Aspartame) — May influence glucose tolerance, appetite regulation, and gut-brain signalling. • Synthetic colours (e.g. Tartrazine, Allura Red) — Associated with hyperactivity in children and possible allergic or immune effects. • Preservatives (e.g. Sodium nitrite, benzoates, sulphites) — Some linked to cancer risk, oxidative stress, and hypersensitivity reactions. |
| Fermented (Live) | Fermented foods like kimchi, yogurt (with live cultures), miso and sauerkraut may support immune function, digestion, and nutrient absorption through the promotion of beneficial gut bacteria. |
| Score (/100) | Our scoring system addresses all of the above with lower scores being linked to poorer health outcomes; higher scores reflect more balanced, minimally processed foods better for our gut health. |
The "sciency" bit
What does the research say?
Ultra processed foods are designed for extreme convenience, long shelf‑life and hyper‑palatability, but in doing so they strip out natural fibre, phytonutrients and live enzymes essential for gut and metabolic health.
While they can be handy in a pinch, the trade‑off is a product that your body treats very differently from minimally processed foods. These man‑made foods and ingredients promote over‑eating, disrupt your microbiome and have been linked to obesity, diabetes, cardiovascular disease and even certain cancers.
In short, ultra‑processed foods may offer convenience, but they come at a steep cost to long‑term health.
A large study of over one million participants found that with each 10% increase in UPF intake corresponded to a 10% increase in death, with clear links to cardiovascular disease, type 2 diabetes and metabolic syndrome PMC.
Other research suggests when people switch to an ultra processed diet, they spontaneously eat more, gain weight and report greater digestive discomfort.
Beyond the processing itself, many UPFs are packed with emulsifiers and other additives that interfere directly with your intestinal lining.
Common emulsifiers like polysorbate 80 and carboxymethylcellulose damage the mucus barrier, promote gut “leakiness”, also known as leaky gut, and may contribute to inflammation and conditions such as IBS. They may even exacerbate symptoms of eczema and skin conditions PMC.
Research shows that these additives may contribute to gut dysbiosis, by shifting the balance of gut bacteria toward more pro-inflammatory species, and increasing the risk of symptoms like abdominal pain, diarrhoea and unpredictable bowel habits.
Diets heavy in salt are a known driver of hypertension and may worsen IBS pain by altering the microbiome’s composition.
Finally, added sugars have been shown to drive non-alcoholic fatty liver disease (NAFLD) and worsen insulin resistance. Human trials found that daily fructose sweetened beverages boost visceral fat and blood lipids, key indicators to chronic liver injury and type 2 diabetes.
Together, this body of evidence underpins our decision to heavily penalise UPFs, high sodium and added sugar ingredients repeatedly tied to cancer, metabolic disease and worsening gut health conditions.
The importance of testing your microbiome
Foods containing UPF's, high levels of fat, sodium, sugar and additives can significantly shift the balance of the gut microbiome, it does this by essentially feeding the "bad", harmful or opportunistic bacteria within our gut microbiome. If those bacteria types start to grow in numbers, they can overpopulate the gut microbiome and reduce the numbers of beneficial bacteria that are essential to our gut and overall health.
A comprehensive gut microbiome test kit can give us a really good picture of the state of your gut health and identify any imbalances that can cause symptoms and impact our health.
Make it healthier
The "mostly" English
Shave 500 calories off your full English with these simple swaps
Here’s a gut‑friendly reboot of the classic Full English Breakfast which cuts calories, ultra‑processed ingredients and sodium while boosting fibre and live cultures with a little hint of East Asia.
| Original ingredient | Swap with | Why & benefits |
|---|---|---|
| Pork sausages (×2) 300 kcal, 28 g fat, UPF |
Turkey sausages (×2) 240 kcal, 14 g fat, UPF |
Lean turkey cuts 10 g fat & 60 kcal; many brands are minimally processed—no hidden emulsifiers or colourings. |
| Back bacon (×2) 150 kcal, 12 g fat, UPF |
Trimmed & grilled back bacon 120 kcal, 8 g fat, UPF |
Trimming & grilling reduces fat by 33% and removes brine additives. |
| Fried egg (1) 90 kcal, 7 g fat |
Poached egg (1) 70 kcal, 5 g fat |
Poaching saves 20 kcal and avoids cooking oil. |
| Fried bread 200 kcal, UPF Yes |
Wholegrain toast (1 slice) 80 kcal, UPF No |
Wholegrain adds +2 g fibre, cuts 120 kcal and removes ultra‑processed batter. |
| Baked beans (½ tin) 160 kcal, UPF Yes |
Homemade beans (½ cup) 140 kcal, UPF No |
Dried beans, tomato & spices save 20 kcal and slash sodium and additives. |
| Grilled tomato & mushrooms | Spinach & kimchi | Spinach adds +1 g fibre & micronutrients; kimchi gives a +5‑point fermented bonus for gut health. |
| Metric | Original Full English | “Mostly English” | Improvement |
|---|---|---|---|
| Calories | 1 279 kcal | 779 kcal | −500 kcal (−39%) |
| Total Fat | 89.5 g | 44 g | −45.5 g (−51%) |
| Sodium | 3 141 mg | 1 800 mg | −1 341 mg (−43%) |
| Fibre | 8.5 g | 14 g | +5.5 g (+65%) |
| Ultra-processed items | 6 | 2 | −4 items |
| Additives | Yes | No | Eliminated emulsifiers, colours & preservatives |
| Fermented foods | 0 | +5 | Added kimchi live cultures |
The full data set
Click on the individual country specific tabs to view a breakdown of the ingredients we measured during our research.
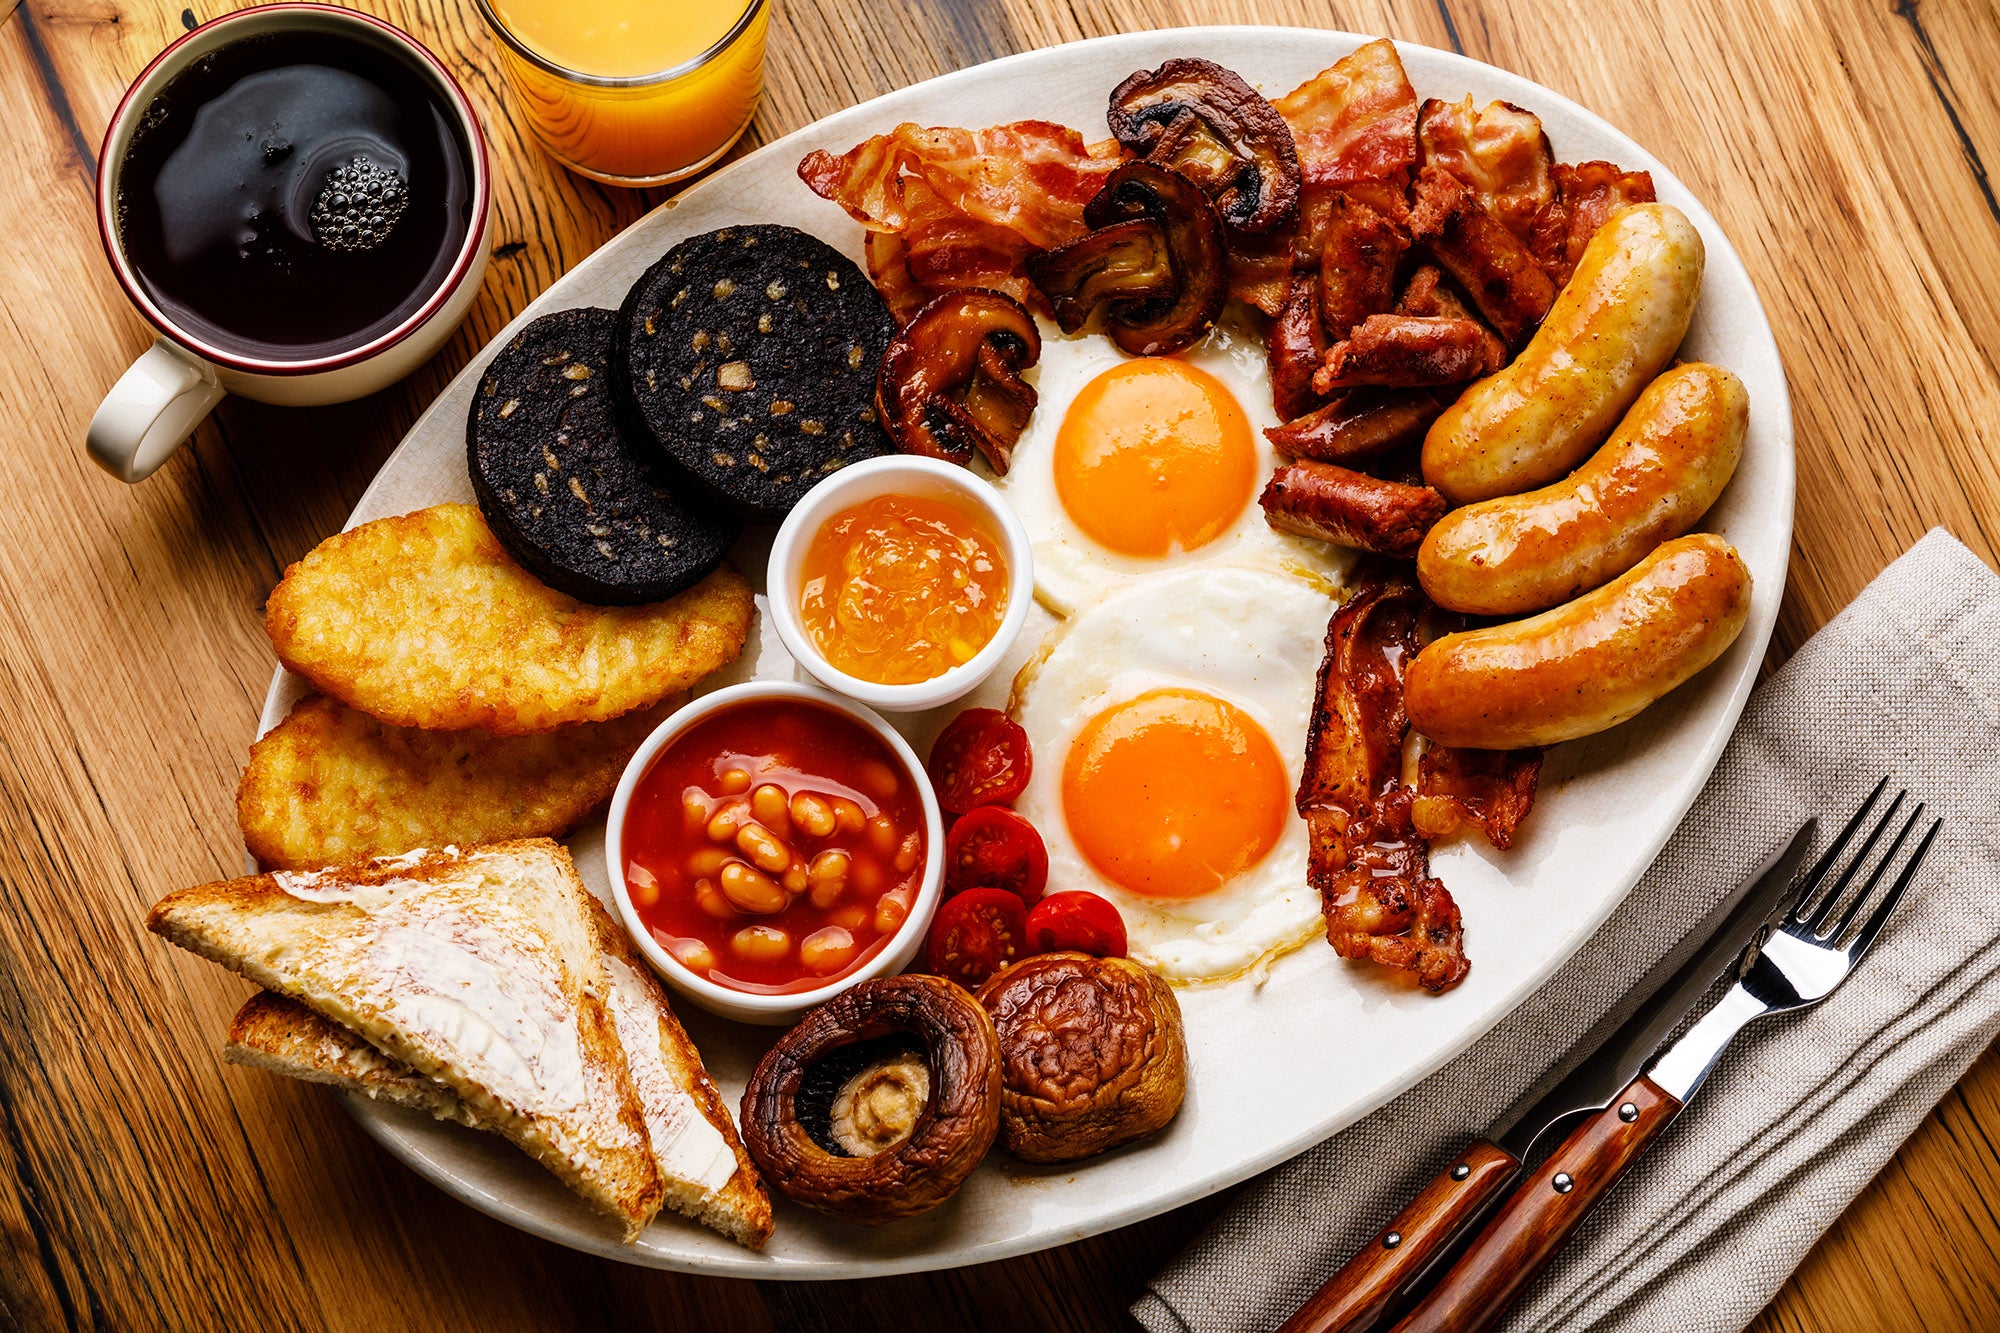
🇬🇧 Full English Breakfast
| Ingredient | kcal | Fat | Sugar | Sodium | Fibre | UPF | Additives |
|---|---|---|---|---|---|---|---|
| Pork Sausage (2) | 300 | 28 | 1 | 700 | 0 | Yes | Yes |
| Back Bacon (2) | 150 | 12 | 0 | 600 | 0 | Yes | Yes |
| Black Pudding (1) | 189 | 15.5 | 0.5 | 581 | 0.5 | Yes | Yes |
| Fried Egg (1) | 90 | 7 | 0 | 90 | 0 | No | No |
| Fried Bread | 200 | 14 | 0 | 300 | 1 | Yes | Yes |
| Baked Beans (½ can) | 160 | 1 | 5 | 500 | 4 | Yes | Yes |
| Grilled Tomato | 20 | 0 | 2 | 10 | 1 | No | No |
| Mushrooms (fried) | 60 | 5 | 0 | 10 | 1 | No | No |
| Hash Brown (1) | 110 | 7 | 0 | 350 | 1 | Yes | Yes |
| Total | 1,279 | 89.5 | 8.5 | 3,141 | 8.5 | 6 | Yes |
🇦🇺 Meat Pie & Chips
| Ingredient | kcal | Fat | Sugar | Sodium | Fibre | UPF | Additives |
|---|---|---|---|---|---|---|---|
| Pastry Shell | 400 | 25 | 1 | 300 | 1 | Yes | Yes |
| Beef Mince | 350 | 20 | 0 | 500 | 0 | Yes | Yes |
| Onions & Seasoning | 30 | 0.2 | 3 | 200 | 1 | No | No |
| Gravy | 120 | 5 | 0 | 200 | 0 | Yes | Yes |
| Chips | 341 | 12 | 3 | 600 | 3 | Yes | Yes |
| Total | 1,341 | 72 | 5 | 1,800 | 4 | 4 | Yes |
🇺🇸 Cheeseburger & Fries
| Ingredient | kcal | Fat | Sugar | Sodium | Fibre | UPF | Additives |
|---|---|---|---|---|---|---|---|
| Burger (bun+patty+cheese+sauce) | 650 | 39 | 8 | 1,040 | 3 | Yes | Yes |
| Fries | 359 | 12 | 2 | 150 | 6 | Yes | Yes |
| Total | 1,009 | 51 | 10 | 1,190 | 9 | 4 | Yes |
🇨🇦 Poutine
| Ingredient | kcal | Fat | Sugar | Sodium | Fibre | UPF | Additives |
|---|---|---|---|---|---|---|---|
| Fries | 600 | 35 | 0 | 900 | 2 | Yes | Yes |
| Cheese Curds | 160 | 15 | 0 | 500 | 0 | No | No |
| Gravy | 126 | 7 | 1 | 188 | 3 | Yes | Yes |
| Total | 886 | 57 | 1 | 1,588 | 5 | 3 | Yes |
🇹🇷 Döner Kebab
| Ingredient | kcal | Fat | Sugar | Sodium | Fibre | UPF | Additives |
|---|---|---|---|---|---|---|---|
| Lamb + Beef blend | 700 | 43 | 0 | 1,200 | 0 | Yes | Yes |
| Flatread | 150 | 3 | 2 | 350 | 2 | Yes | Yes |
| Sauce | 100 | 12 | 3 | 100 | 1 | Yes | Yes |
| Total | 950 | 58 | 5 | 1,650 | 3 | 4 | Yes |
🇨🇳 Sweet & Sour Pork
| Ingredient | kcal | Fat | Sugar | Sodium | Fibre | UPF | Additives |
|---|---|---|---|---|---|---|---|
| Pork | 400 | 12 | 0 | 600 | 0 | Yes | Yes |
| Sauce | 300 | 4 | 20 | 200 | 0 | Yes | Yes |
| Peppers & Pineapple | 264 | 12 | 4 | 200 | 3 | No | No |
| Total | 964 | 28 | 24 | 1,000 | 3 | 2 | Yes |
🇬🇷 Moussaka
| Ingredient | kcal | Fat | Sugar | Sodium | Fibre | UPF | Additives |
|---|---|---|---|---|---|---|---|
| Aubergine | 100 | 7 | 2 | 200 | 2 | No | No |
| Minced Meat | 200 | 10 | 0 | 300 | 0 | No | No |
| Tomato Sauce | 56 | 1 | 2 | 100 | 1 | No | No |
| Cheese | 200 | 11 | 2 | 200 | 1 | Yes | Yes |
| Total | 556 | 29 | 6 | 800 | 4 | 1 | Yes |
🇹🇭 Pad Thai
| Ingredient | kcal | Fat | Sugar | Sodium | Fibre | UPF | Additives |
|---|---|---|---|---|---|---|---|
| Rice Noodles | 350 | 5 | 2 | 400 | 2 | Yes | Yes |
| Egg | 90 | 7 | 0 | 90 | 0 | No | No |
| Sauce | 100 | 4 | 3 | 200 | 0 | Yes | Yes |
| Peanuts | 60 | 6 | 1 | 100 | 2 | No | No |
| Veg Garnish | 0 | 0 | 2 | 410 | 0 | No | No |
| Total | 600 | 22 | 8 | 1,100 | 4 | 1 | Yes |
🇷🇺 Beef Stroganoff
| Ingredient | kcal | Fat | Sugar | Sodium | Fibre | UPF | Additives |
|---|---|---|---|---|---|---|---|
| Beef | 250 | 15 | 2 | 400 | 0 | No | No |
| Sauce (cream & mushroom) | 150 | 6 | 2 | 200 | 0 | Yes | Yes |
| Rice | 50 | 3 | 0 | 200 | 2 | No | No |
| Total | 450 | 24 | 4 | 800 | 2 | 1 | Yes |
🇲🇽 Tacos al Pastor (2)
| Ingredient | kcal | Fat | Sugar | Sodium | Fibre | UPF | Additives |
|---|---|---|---|---|---|---|---|
| Tortillas (2) | 140 | 3 | 1 | 100 | 2 | Yes | No |
| Marinated Pork | 200 | 10 | 3 | 200 | 1 | Yes | Yes |
| Salsa | 80 | 3 | 3 | 210 | 1 | No | No |
| Total | 420 | 16 | 7 | 510 | 4 | 1 | Yes |
🇮🇩 Nasi Goreng
| Ingredient | kcal | Fat | Sugar | Sodium | Fibre | UPF | Additives |
|---|---|---|---|---|---|---|---|
| Rice | 300 | 0 | 1 | 0 | 0 | No | No |
| Egg | 90 | 7 | 0 | 90 | 0 | No | No |
| Sauce | 100 | 2 | 1 | 200 | 0 | Yes | Yes |
| Vegetables | 50 | 2 | 2 | 50 | 1 | No | No |
| Oil (frying) | 79 | 12 | 0 | 560 | 2 | Yes | Yes |
| Total | 619 | 23 | 4 | 900 | 3 | 2 | Yes |
🇩🇪 Bratwurst & Sauerkraut
| Ingredient | kcal | Fat | Sugar | Sodium | Fibre | UPF | Additives |
|---|---|---|---|---|---|---|---|
| Bratwurst (2) | 500 | 30 | 1 | 900 | 0 | Yes | Yes |
| Sauerkraut | 343 | 25 | 4 | 900 | 5 | No | No |
| Total | 843 | 55 | 4 | 1,800 | 5 | 1 | Yes |
🇮🇹 Spaghetti Bolognese
| Ingredient | kcal | Fat | Sugar | Sodium | Fibre | UPF | Additives |
|---|---|---|---|---|---|---|---|
| Spaghetti | 300 | 2 | 2 | 10 | 3 | No | No |
| Bolognese Sauce | 367 | 20 | 4 | 627 | 3 | Yes | Yes |
| Total | 667 | 22 | 6 | 637 | 6 | 1 | Yes |
🇧🇷 Feijoada
| Ingredient | kcal | Fat | Sugar | Sodium | Fibre | UPF | Additives |
|---|---|---|---|---|---|---|---|
| Beans | 300 | 1 | 2 | 200 | 5 | No | No |
| Pork Meat | 320 | 34 | 0 | 900 | 2 | Yes | Yes |
| Total | 620 | 35 | 2 | 1,100 | 7 | 1 | Yes |
🇪🇸 Paella
| Ingredient | kcal | Fat | Sugar | Sodium | Fibre | UPF | Additives |
|---|---|---|---|---|---|---|---|
| Rice | 400 | 2 | 0 | 10 | 2 | No | No |
| Seafood | 200 | 10 | 1 | 200 | 1 | No | No |
| Vegetables | 152 | 22 | 1 | 1,090 | 1 | No | No |
| Total | 752 | 34 | 2 | 1,300 | 4 | 0 | No |
🇫🇷 Pot-au-Feu
| Ingredient | kcal | Fat | Sugar | Sodium | Fibre | UPF | Additives |
|---|---|---|---|---|---|---|---|
| Beef | 300 | 10 | 1 | 200 | 0 | No | No |
| Vegetables | 135 | 2 | 2 | 350 | 3 | No | No |
| Broth | 100 | 4 | 1 | 350 | 3 | No | No |
| Total | 535 | 16 | 4 | 900 | 6 | 0 | No |
🇳🇬 Jollof Rice
| Ingredient | kcal | Fat | Sugar | Sodium | Fibre | UPF | Additives |
|---|---|---|---|---|---|---|---|
| Rice | 200 | 1 | 1 | 0 | 0 | No | No |
| Tomato Sauce | 100 | 0 | 0 | 200 | 2 | No | No |
| Oil & Spices | 93 | 13 | 0 | 500 | 0 | Yes | Yes |
| Total | 393 | 15 | 2 | 700 | 2 | 1 | Yes |
🇮🇳 Dal & Rice
| Ingredient | kcal | Fat | Sugar | Sodium | Fibre | UPF | Additives |
|---|---|---|---|---|---|---|---|
| Dal | 200 | 4 | 1 | 400 | 5 | No | No |
| Rice | 93 | 2 | 0 | 200 | 2 | No | No |
| Total | 293 | 6 | 1 | 600 | 7 | 0 | No |
🇯🇵 Miso Soup & Rice
| Ingredient | kcal | Fat | Sugar | Sodium | Fibre | UPF | Additives |
|---|---|---|---|---|---|---|---|
| Miso Soup | 50 | 1 | 1 | 500 | 0 | No | No |
| Rice | 214 | 2 | 0 | 205 | 1 | No | No |
| Total | 264 | 3 | 1 | 705 | 1 | 0 | No |
🇰🇷 Kimchi & Rice
| Ingredient | kcal | Fat | Sugar | Sodium | Fibre | UPF | Additives |
|---|---|---|---|---|---|---|---|
| Kimchi | 60 | 1 | 2 | 400 | 2 | No | No |
| Rice | 240 | 0 | 0 | 100 | 3 | No | No |
| Total | 300 | 1 | 2 | 500 | 5 | 0 | No |
Our methodology
Selecting the dishes
Top 20 globally consumed traditional dishes, drawn from UNESCO listings, national food boards and global culinary surveys.
Nutrient data collection
For every core ingredient in each dish (e.g. sausages, bread, beans, sauces), we pulled nutrient values (kcal, total fat, added sugar, sodium, fibre) from three independent, publicly accessible databases:
Nutritionix
SnapCalorie
Fitia
Where all three sources provided a value, we averaged them to smooth out recipe and measurement differences.
Ultra-processed foods and additives
We flagged each ingredient using the NOVA system, specifically categories 3-4:
Ultra-processed (UPF) = NOVA groups 3–4 (e.g. reformed meats, packaged pastry, industrial sauces).
We counted the total UPF ingredients per dish.
We also identified additives within ingredients.
Emulsifiers (e.g. Polysorbate 80, CMC)
Artificial sweeteners (Sucralose, Aspartame)
Synthetic colours (Tartrazine, Allura Red)
Preservatives (Sodium nitrite, Benzoates, Sulphites)
How we scored each dish
We used a scoring threshold of 0 - 100.
If a dish uses all of your Recommended Dailly Intake, say, 2 500 kcal, it costs you 10 points. If it only uses half your budget, it costs you 5 points, and so on.
Here is the calculation we used for the Full English Breakfast
Calories - 1 279 kcal ÷ 2 500 (RDI) × 10 = 5.1 (-5.1 points)
Fat - 89.5 g ÷ 70 g × 10 = - 12.8 points
Sugar - 8.5 g ÷ 50 g × 10 = - 1.7 points
Sodium - 3 141 mg ÷ 2 300 mg × 10 = –13.7 points
Minus processing/additives
–5 points for each ultra-processed ingredient
–10 points if any emulsifiers, artificial sweeteners, colours or preservatives are used
Plus gut friendly boosts
+1 point per 2 g fibre (up to +5 points)
+5 points if a live-culture fermented food is included
Final score = 100 - (all deductions) + (all bonuses)
References
NOVA Classification System
Nutritionix Database
https://www.nutritionix.com
SnapCalorie
https://snapcalorie.com
Fitia
https://fitia.app/
UPF intake & all‑cause mortality, JAMA Internal Medicine.
British Heart Foundation
UPFs & cardiovascular risk
Emulsifiers, gut barrier disruption & inflammation, Nature.
Trans fats & coronary heart disease risk, New England Journal of Medicine.
Salt reduction & cardiovascular outcomes, BMJ.
Artificial sweeteners, microbiome changes & glucose intolerance, Nature.